Overview of Chart Features
Access the Charts
screen (also referred to as Interactive Charts) by clicking Charts
from the Navigation menu.
The window features three distinct sections:
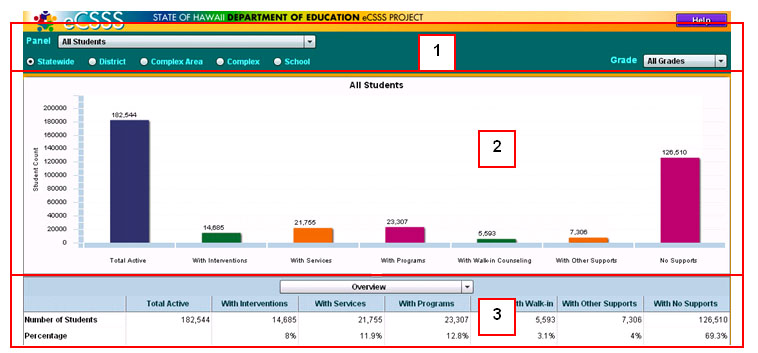
1) Selection Bar -
Select your parameters

- Panel
- Choose which set of records you wish to review, either:
- All
Students -
Shows how many students are receiving supports or
services.
- HSA
Non-Proficiency - Shows how many students have earned
non-proficient scores on HSA, HAPA and HSAA tests and whether
those students are receiving CSSS supports and services.
- Level
- Select the DOE level
that applies (Statewide, District, Complex Area, Complex or School),
then use the drop-down menu to select the appropriate District, Complex
Area, Complex or School.
- Grade
- Narrow your results further by selecting a grade. Selecting
Across Grades shows a different chart. This selection is not available
for the All Students panel.
2) Charts
- Charts provide a graphical summary of the selected Panel
(i.e., All Schools or HSA Non-Proficiency). Clicking a bar in the
bar chart will change data in the tables below.
3) Tables - Tables provide summaries and more detailed
data that support what is depicted in the graphical charts above. You
can drill down for greater detail.