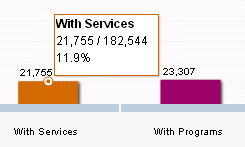
The All Students chart shows the number of students receiving supports and services. The charts display data for the group you select, whether state, district, school, etc. You can also refine your results by selecting the Grade level.
The groups represented by bars are:
Total Active - The number of active students in the selected level (e.g., state, district, school, etc.)
With Interventions - The number of active students with interventions in the current school year. This includes Type 1, Type 2, Type 3, chapter 19 and school interventions.
With Services - The number of active students with services, either IDEA or 504, in the current school year.
With Programs -The number of active students in programs the current school year. This includes PSAP, PSSAS, GT, PGT, School Program, Title I: Targeted Assistance Program and ELL.
With Walk-In Counseling - The number of active students who received walk-in counseling sessions in the current school year. This includes school Walk-In Counseling, School/College Career Counseling Walk-In and SBBH Counseling Walk-In.
With Other Supports - The number of active students who received other supports in the current school year. This includes Action Plans, Single Supports, Group Supports and Support Package Supports. NOTE: Action Plans with ELL are not included in Other Supports
No Supports - The number of active students who received no supports in the current school year.

TIP:
When you place your mouse over a bar and it becomes a hand (![]() ),
that means you can drill down for more information (displayed in the table
below). You'll also notice that a box displays quick information about
the bar.
),
that means you can drill down for more information (displayed in the table
below). You'll also notice that a box displays quick information about
the bar.

Click on any bar to see detailed information in the tables below.