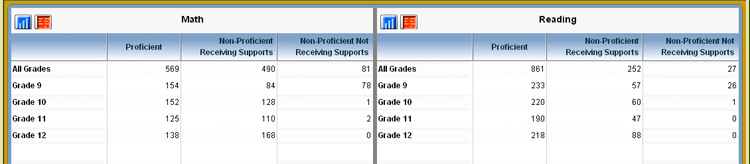
The Math and Reading chart shows the results of the most recent HSA, HAPA or HSAA exam for each student who is active in the current school year.
NOTE: While the headings refer to HSA, it is possible that a particular student’s most recent state assessment is HAPA or HSAA. If you have access to the Student Detail View (described in Tables), you can see what type of test the student took.
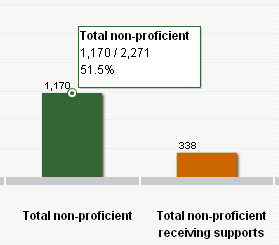
TIP:
When you place your mouse over a bar and it becomes a hand (![]() )
that means you can drill down for more information (displayed in the table below). You'll also notice that
a box displays quick information about the bar.
)
that means you can drill down for more information (displayed in the table below). You'll also notice that
a box displays quick information about the bar.
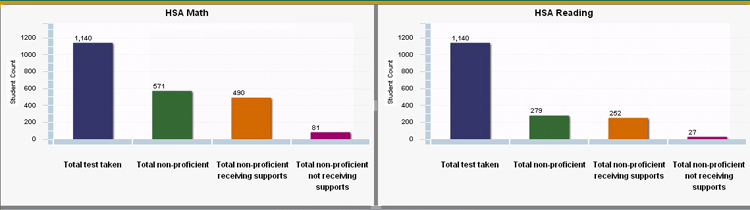
BLUE BAR: Total test taken
The main chart shows the total number of active students that have taken a HSA, HAPA or HSAA math or reading test, regardless of which year the test was taken. The proficiency refers to whether or not the student was non-proficient in the most recent math or reading test. If the student did not take one of the tests (e.g., due to illness) then the student is not included in the counts for the test that was missed, but is included in the counts for the test that was taken. As a result, there may be small differences between the number of students that have taken the math test and the number of students that have taken the reading test.
GREEN BAR: Total non-proficient
Students are included in the total non-proficient count for math if the student has a proficiency of well below or approaching on the most recent math test (HSA, HAPA or HSAA). Students are included in the total non-proficient count for reading if the student has a proficiency of well below or approaching on the most recent reading test (HSA, HAPA or HSAA). The total non-proficient count is the sum of the total non-proficient receiving supports (orange column) count plus the total non-proficient not receiving supports count violet column).
ORANGE BAR: Total non-proficient receiving supports
Students who are non-proficient are further analyzed to determine whether the student is receiving CSSS supports. Students with supports that are active in the current school year are classified as receiving supports. A support is considered active in the current school year if it does not have an end/closing date or if the end/closing date is in the current school year. If a student is flagged as IDEA eligible, 504 eligible, or receiving ELL, then the student is automatically included in the total non-proficient receiving supports count, even if the student does not have any supports listed in the Supports tab of the Student Profile within eCSSS. Walk-in Interventions, Indirect Supports and Non-student Supports are not included but all other supports are.
VIOLET: Total non-proficient not receiving supports
All non-proficient students who do not qualify to be counted as receiving supports according to the description above are included in the count of students who are non-proficient and not receiving CSSS supports.
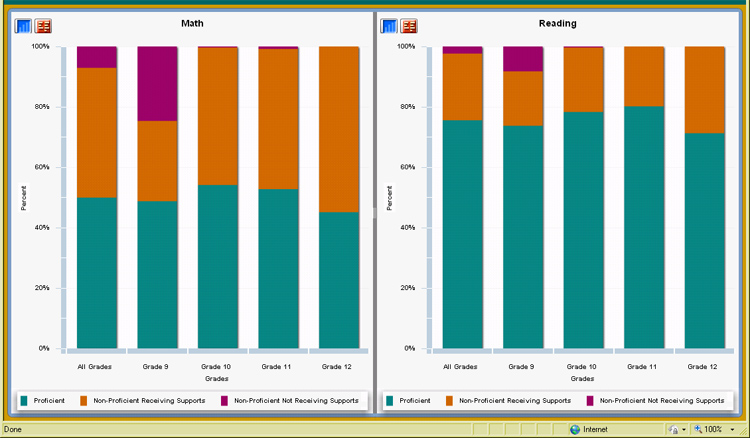
View of Charts for Grades
Note that when you select to view the data by Grades > Across Grades, the chart will look like this:
Clicking the following icons ![]() will
provide statistics that match the bar charts.
will
provide statistics that match the bar charts.