Progress Charts are added by clicking on the Add button at the bottom of the Progress Charts tab on the Student Profile.
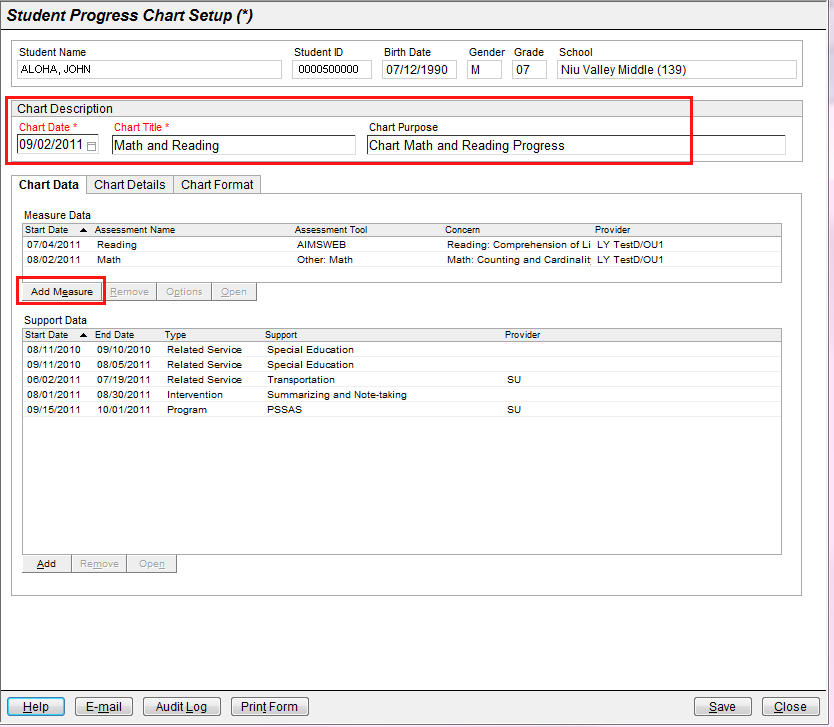
The Student Progress Chart Setup screen will be displayed, as shown below.
Enter a Chart Date and Chart Title and optionally enter a description of the Chart Purpose.
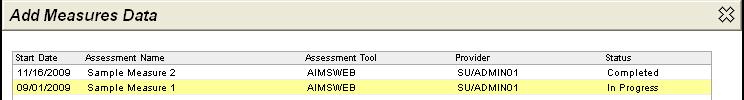
Select Add Measure to display a list of available Measures. The only Measures listed are those that include the name of the student for whom you are building a Progress Chart.
Select the Measure that you want to display on the Progress Chart, and it will be shown in the Measure Data section. You can add up to three measures for a student and they will be displayed on the list of measures for the student. If three measures have already been added, you must select and Remove one of the existing measures before adding another.
Once a Measure is added to the Progress Chart, select the Measure in the Measure Data section to enable the Remove, Options and Open buttons. Click the Open button to open the Student Measure and add or change Assessment Dates and Scores/Comments for the student. Click the Options button to display the Measure Data Options window shown below.
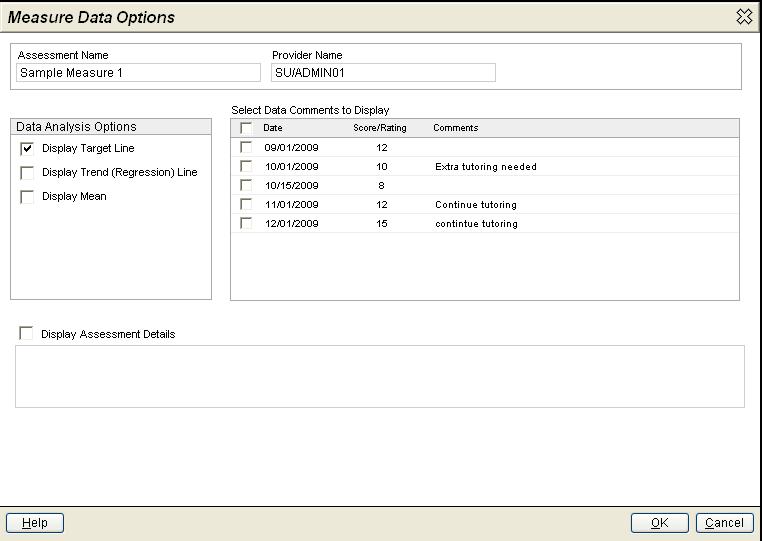
Select the Data Analysis Options to determine what types of data should be shown on the Progress Chart.
Select the Assessment Dates for which Comments should be shown. The chart will show all Assessment Dates, but you have the option of also including comments in a data table.
Check the Display Assessment Details to display the Assessment Details for the Measure.
Click OK to save your changes.
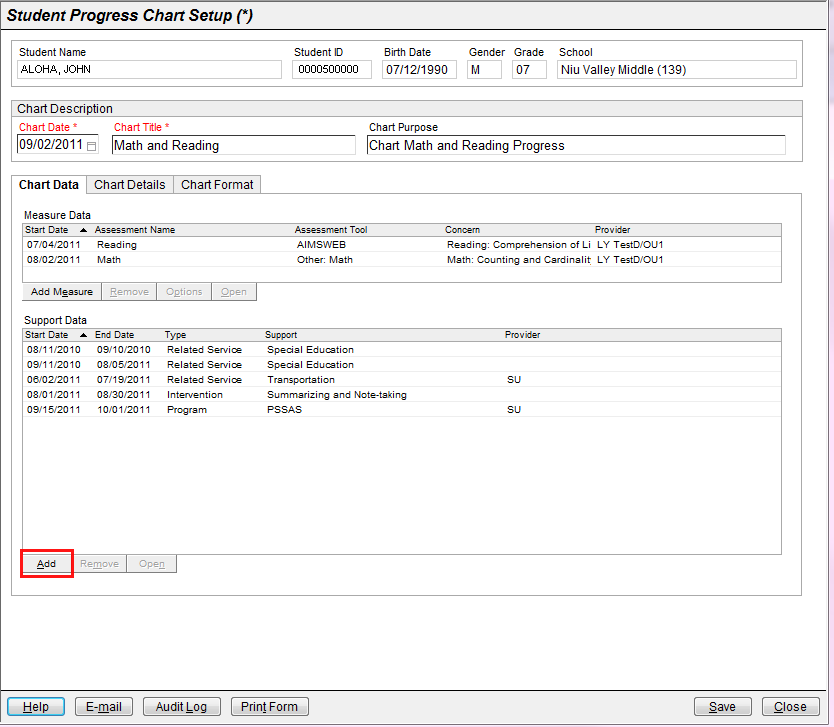
At the bottom of the Student Progress Chart Setup screen, select Add and add up to 10 relevant supports to show on the Progress Chart. Interventions, Programs or Related Services may be added as support data.
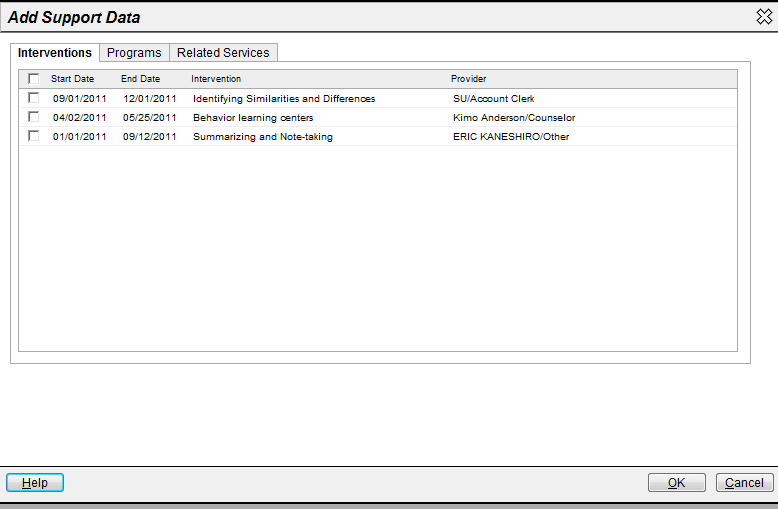
To view a support, highlight the Support and select the Open button.
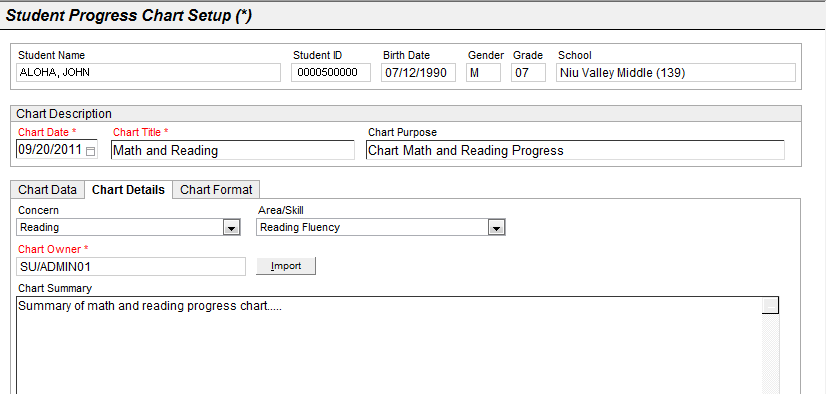
Select the Chart Details tab to expand on the purpose of the chart. You can indicate the Concern and the specific Area/Skill within the broader concern or an Other Concern.
You can change the Chart Owner by importing another person's name using the Import button. By default, the person setting up the Progress Chart will be included as the Chart Owner.
Write an optional text summary of the chart in the Chart Summary field.
Select the Chart Format tab to define how the chart should be displayed. You can select what to display on the Vertical Axis Label and how to display supports/services (Support Display Style).
The data values are displayed by default, unless the checkmark is removed. Enter checkmarks to display a data table, concern or chart summary.
If you select Auto-fit to Measure, the date range on the chart will coincide with the assessment dates on the Measure. If you uncheck this option, you can display a narrower or more expansive date range (for example to include certain supports/services that took place before the Measure was initiated).
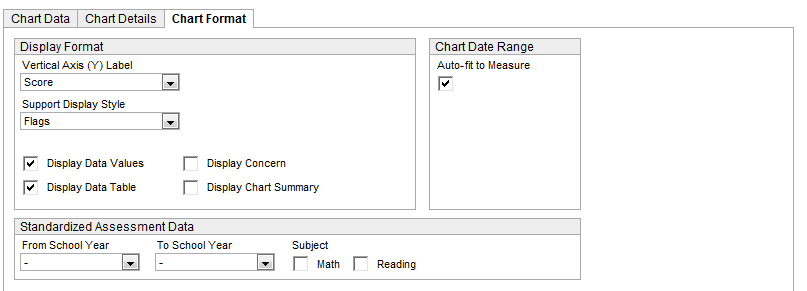
In the Standardized Assessment Data area, select the school year or range of years, and whether to show HSA Math and/or Reading data.
To print the Student Progress Chart, click Print Form. This button is displayed only after you click Save.