Student Progress Chart is defined and can be viewed in the chart setup of Add Progress Chart.
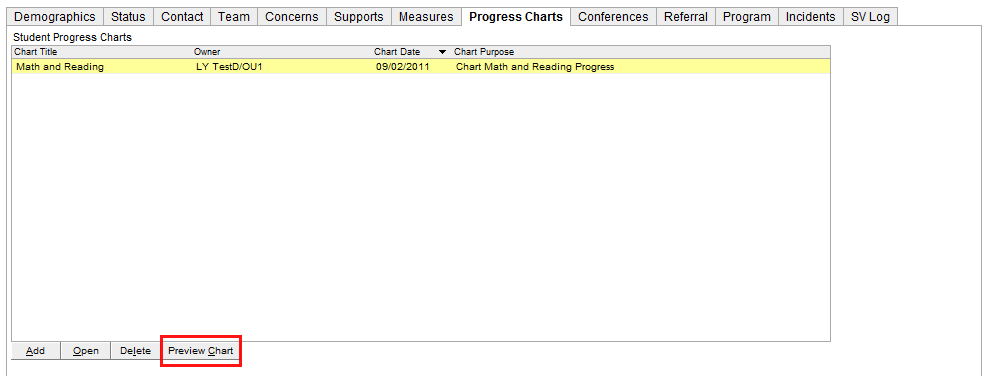
Once the Student Progress Chart is created, it can also be viewed by selecting the chart from the Progress Charts tab on the Student Profile, and clicking the Preview Chart button at the bottom of the window.
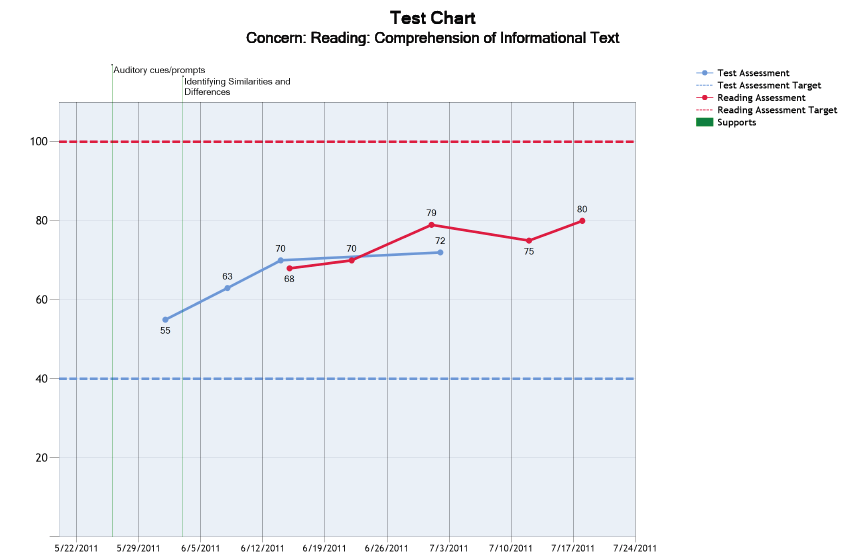
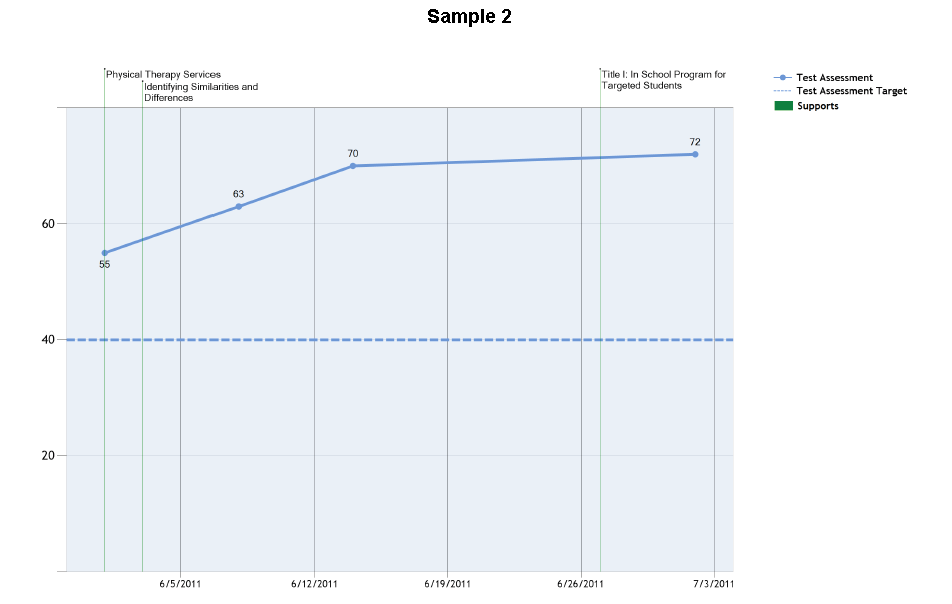
Shown below is an example of a completed Progress Chart.
At the top of the chart is the student's identifying information. Depending on the options selected, the chart will show the Supports, the Measure Target Score, and the student's results charted over time. Use the PDF controls to zoom in or out, view other pages, and Print or Save the chart.
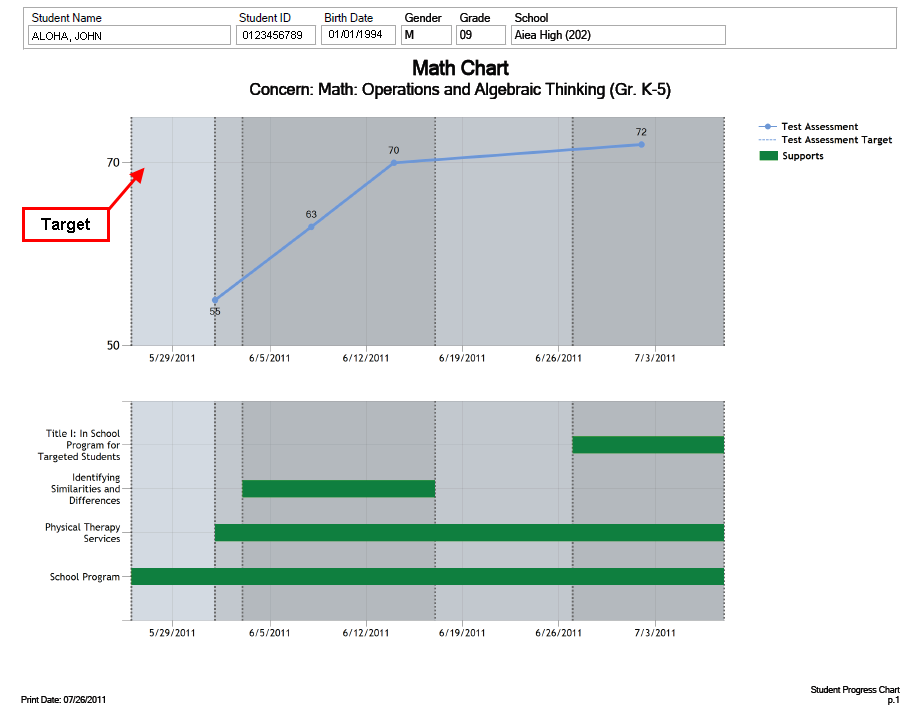
You can experiment with different options in the chart setup until you get the chart to display the information in a way that makes sense to you. Shown below is the same Measure data, along with additional Supports/Services, and a different display format.
A data table, Assessment Details, and Chart Summary can be optionally displayed at the end of the Student Progress Chart. If there are Supports, they will be displayed in table format as well.
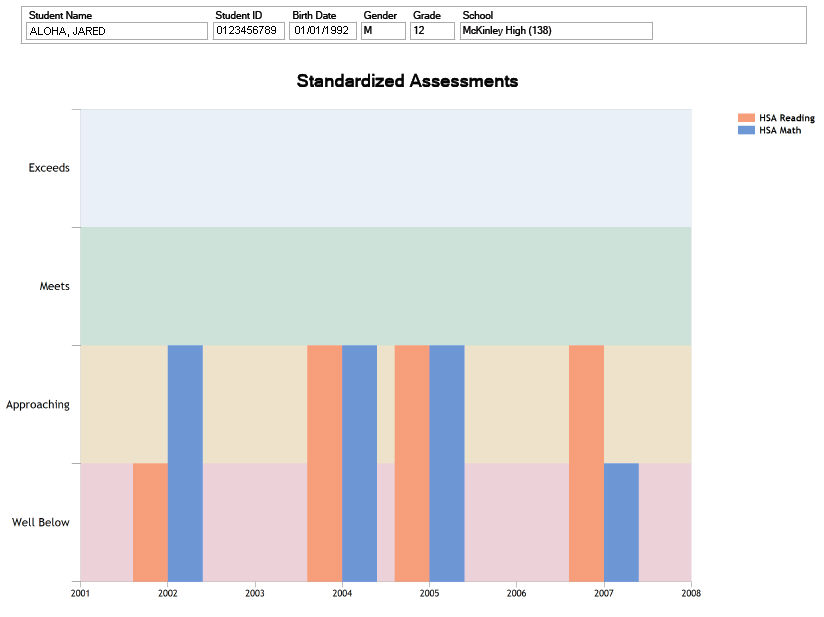
If multiple measures are selected, they will be displayed on the same chart, as shown below.