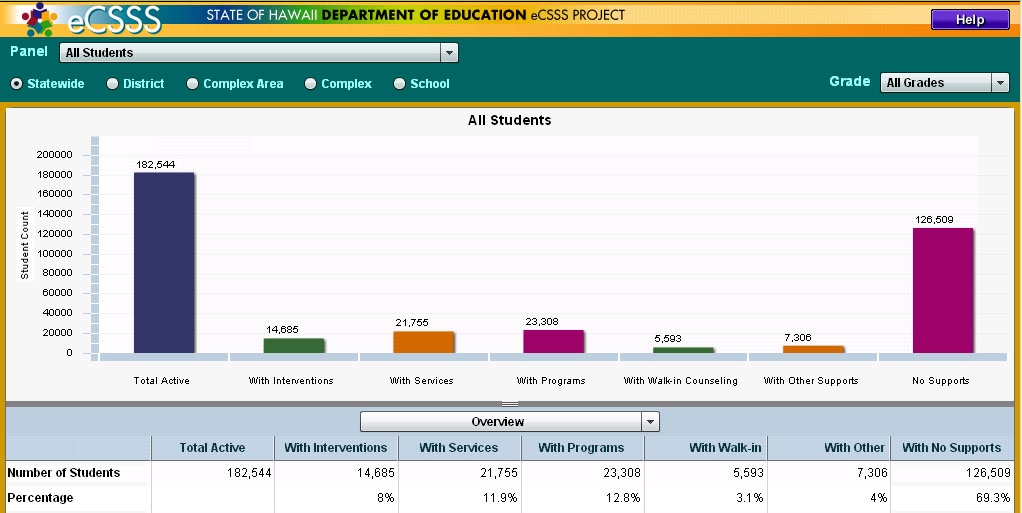
The eCSSS Charts is a tool that helps schools assess student progress and the number of students receiving supports or services. The Charts screen opens with overview information, but because the elements of the charts are clickable, you can drill further to get more specific information, including Student Details (for those authorized to access this data).
Reports reflect point-in-time status because they are dynamically generated based on the existing eCSSS data. Users with appropriate rights can view charts for students at various DOE levels: statewide, district, complex area, complex or school.
Learn more about Charts: